, (LON:LLOY), and (LON:AAL) shares in light of this.)

Share Price Performance Under the Spotlight
In this piece, we will analyse 3 popular shares that investors are looking at, including (LON:RDSA), (LON:LLOY), and (LON:AAL)
1. (LON: RDSA): Royal Dutch Shell
Royal Dutch Shell (LON:RDSA)is an interesting share. It is currently regarded as short-term highly bullish, with overwhelmingly positive trader sentiment. The British/Dutch oil and gas company is deemed a fair value stock, at a price of approximately 1938.60p. Fears in the energy sector have driven down prices for the year-to-date, from a 52-week high of 3.05 to a 52-week low of 2,637.50p. The share price has been eroded by multiple downgrades since September 2019, when Cowen & Company moved to downgrade Royal Dutch Shell plc from an outperform share to a market perform stock. This was followed close in tow by an HSBC downgrade from buy to hold, and a downgrade by Wells Fargo from overweight to equal weight.
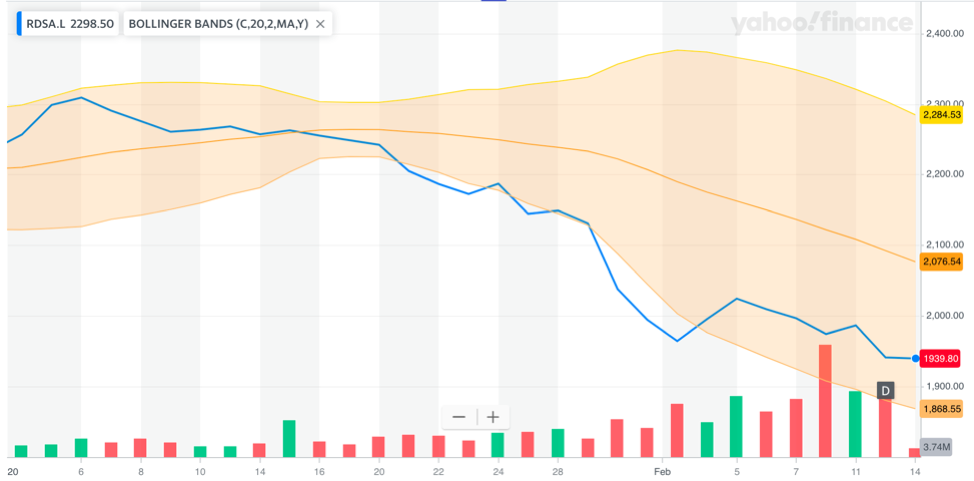
The Bollinger Bands present interesting insights into the technical performance of the stock. Clearly, the current price of the stock at 1938.80p is approaching the bottom Bollinger Band of 1868.55p. It is well below the mean of 2076.54p, indicating that trader sentiment is bearish on the stock. However, the expectation is that the stock will rise if the price crosses the lower Bollinger Band. This will reverse selling sentiment as the stock would be regarded as oversold and traders will buy on the dip. There has been widespread divergence in pricing in February, compared to the latter half of January where the share traded in a tight band.
TAKEAWAY: The blue line below the lower Bollinger Band line indicates oversold territory, which is indicative of the prospect of greater bullish sentiment coming into play. The company’s total revenues have been declining from 12/31/2018 through the present, owing to weaker oil prices and lower global demand.
2. (LON:LLOY): Lloyds Banking Group
Trading of Lloyds Banking Group shares is largely bullish at this time. This leading UK financial enterprise is headquartered in London. Lloyds Banking Group is currently trading at 56.99, and regarded as a fair value share. For the year-to-date, the share price has declined from 63.63 to its current level. As far as earnings go, (LON:LLOY) has posted 3 successive earnings beats, where the consensus EPS (earnings per share) was exceeded by actual performance. The financials of the share reflect growing revenue between 2015 and 2018, and increasing earnings over the same period. In USD, earnings in 2018 were $3.81 billion, and revenue was reported at $17.74 billion. Overall, the recommendation trend for Lloyds Banking Group is a short-term net buy, with analysts pricing it at 75.37.
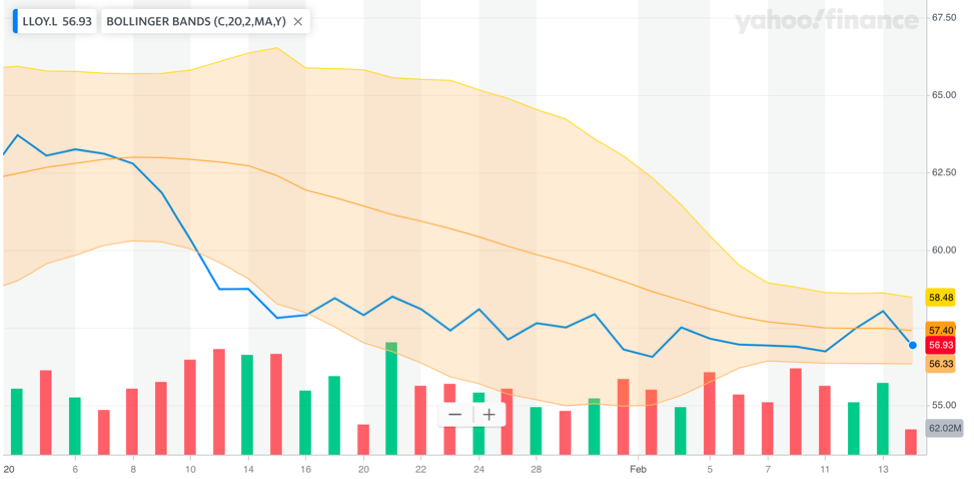
The above chart reflects a consolidation of pricing in recent weeks. The Bollinger Bands have tightened around the stock price, indicating that there is significantly less volatility. The current price of 56.93/99 is trending towards the lower Bollinger Band. If the price breaks below that band, this would indicate the stock is oversold and subject to an upwards revision. Currently, the net sentiment is bullish, with lots of investors jumping onto the share hoping that a British post-Brexit boom wall help it to rally. Since it is largely focused on the UK economy, any uptick in performance of the UK economy should naturally bode well for Lloyds Banking Group. Even Barclays – the UK financial juggernaut – believes that Lloyds is undervalued to the tune of 32% in GBP. Other banking giants like RBC Capital Markets have this stock as their top-ranking large-cap UK bank share.
TAKEAWAY:If Britain’s post-Brexit recovery is strong, expect the share price of (LON:LLOY) to rise precipitously over time. It is currently undervalued and it’s ripe for the picking.
3. (LON:AAL): Anglo American
Anglo American plcis a heavy hitter in the global economy. This leading UK stock is currently net bullish as a CFD trading option, with many traders going long on it. The share price is 2,110.50p, and the year-to-date performance has been mixed, with minimal volatility in the first six weeks of 2020. The 52-week low is 45.26 and the 52-week high is 2,294.00p. The 1-year target estimate price is 24.50, marginally higher than the prevailing stock price of 21.085. What is particularly interesting about the stock is that the earnings have fallen year-on-year between 2017 and 2019, while revenue has increased over that same period.
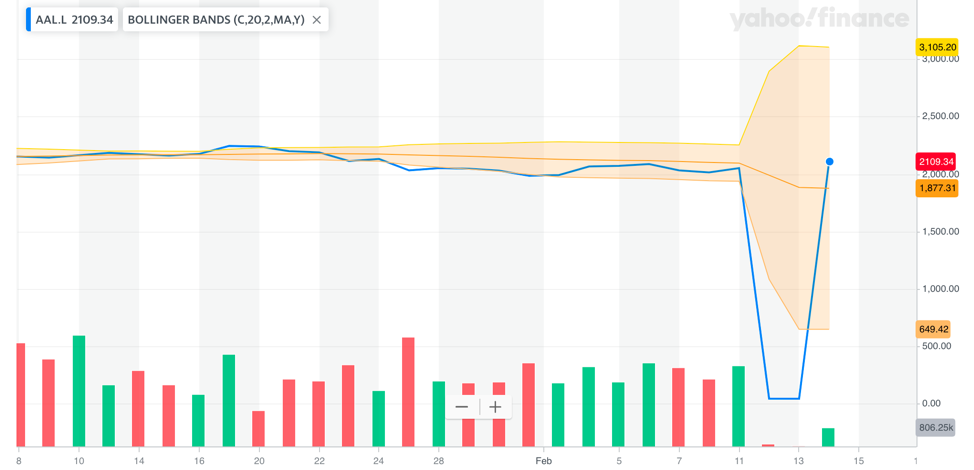
The chart with (LON:AAL) makes for interesting reading. The current Bollinger Bands have formed a wide range in recent days, with the upper end at 3,105.13 and the lower end at 649.41. The median Bollinger Band is currently at 1,877.27. While seemingly unusual, this simply illustrates the volatility in pricing that we have seen impacting the Bollinger Bands indicators. The company recently announced 13% returns on capital, making it an enticing proposition heading into Q2 2020. The 13% figure is neck and neck with the average for the metals and mining industry, making it a satisfactory investment option.
TAKEAWAY:Anglo American is currently regarded as a hold. This rating has not changed for several months. However, there are fewer sell ratings that make up this consensus rating score than a few months ago.